Features
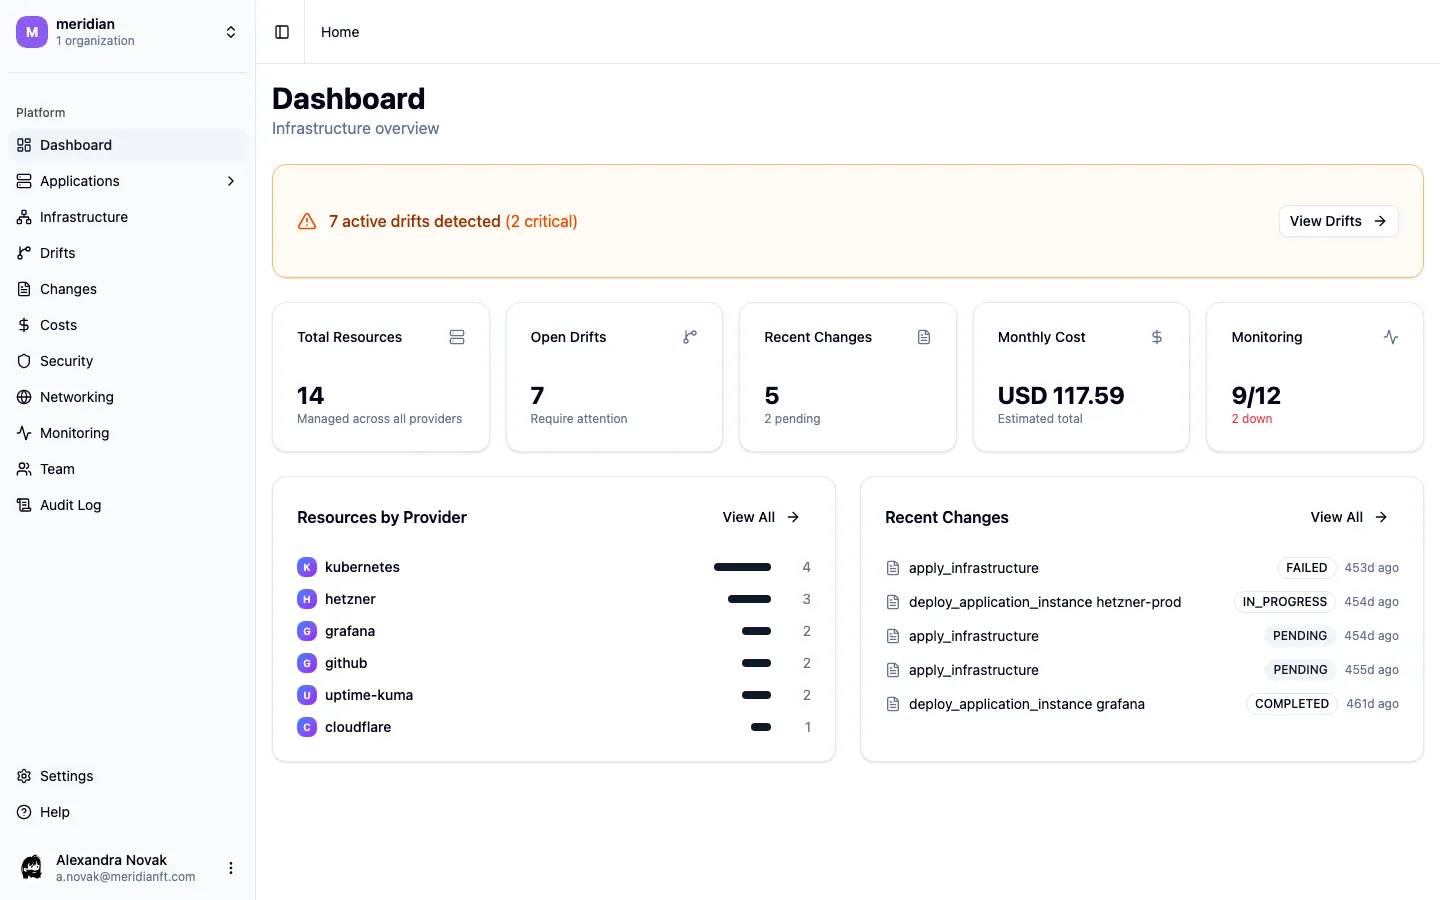
Unified Dashboard
Section titled “Unified Dashboard”One place to see everything. Resource counts by provider, health status, recent changes, cost overview, and active drift alerts — all on a single screen.
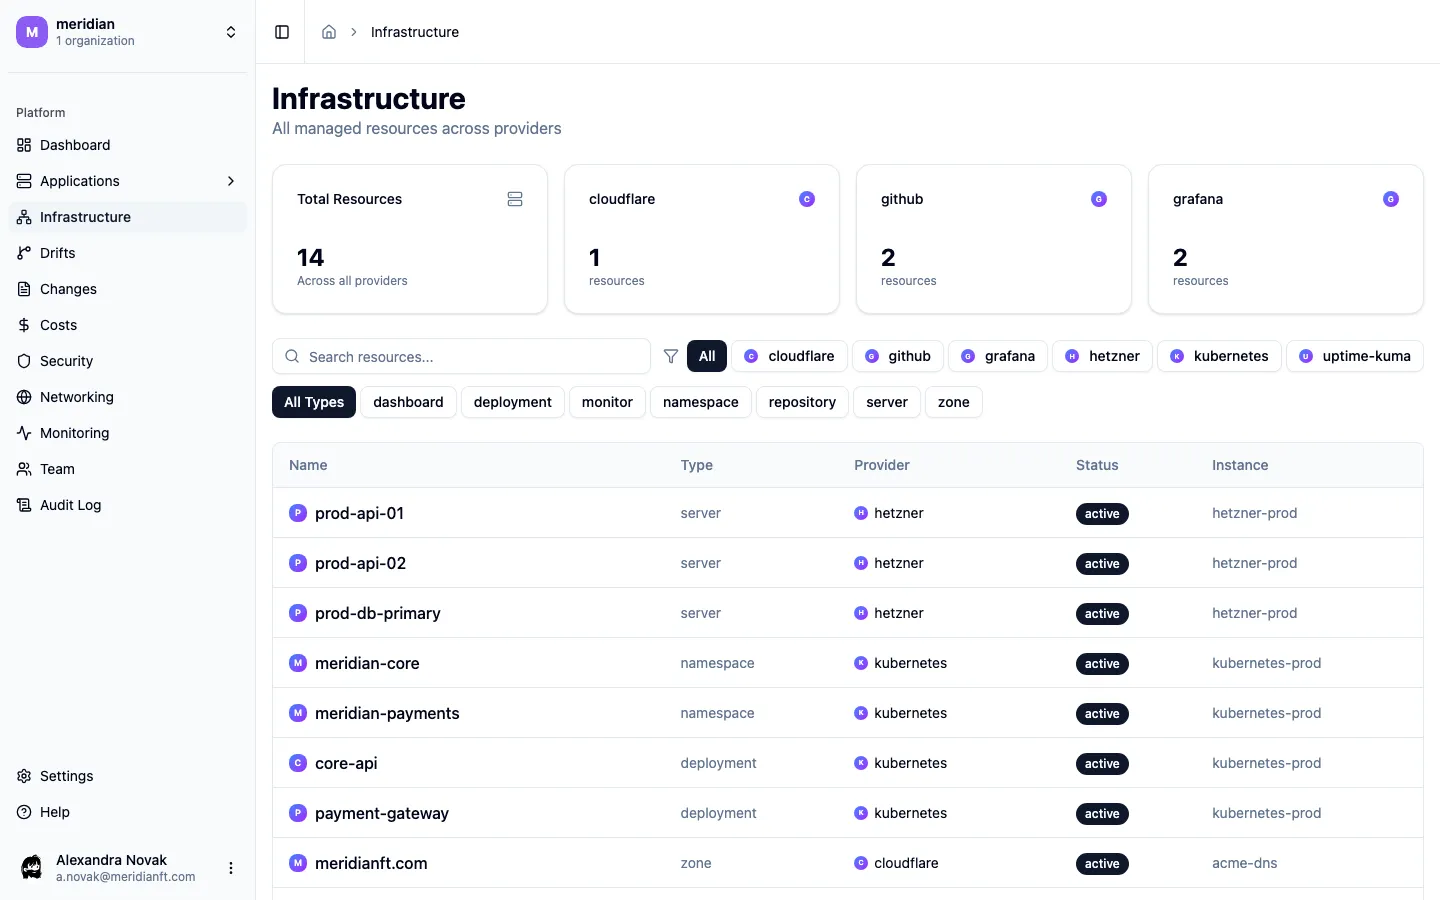
Infrastructure Browser
Section titled “Infrastructure Browser”Browse all managed resources across every provider in one table. Filter by provider, resource type, or status. Direct links to provider consoles when you need them.
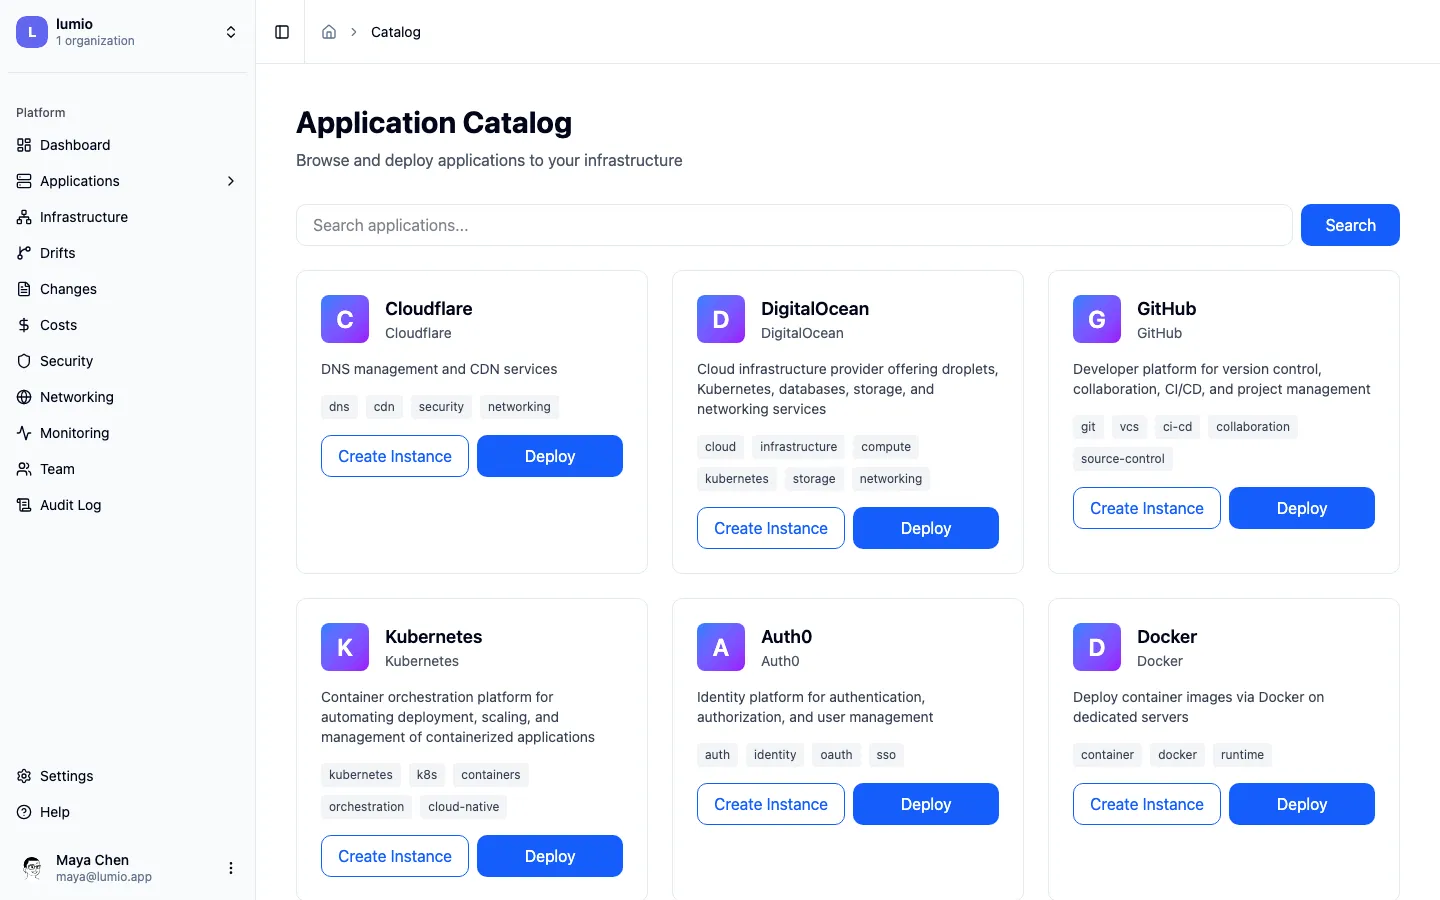
Application Catalog & Deployment
Section titled “Application Catalog & Deployment”Browse available applications (boosters), deploy through a guided wizard, and manage running instances. 14 providers are supported out of the box, with more coming.
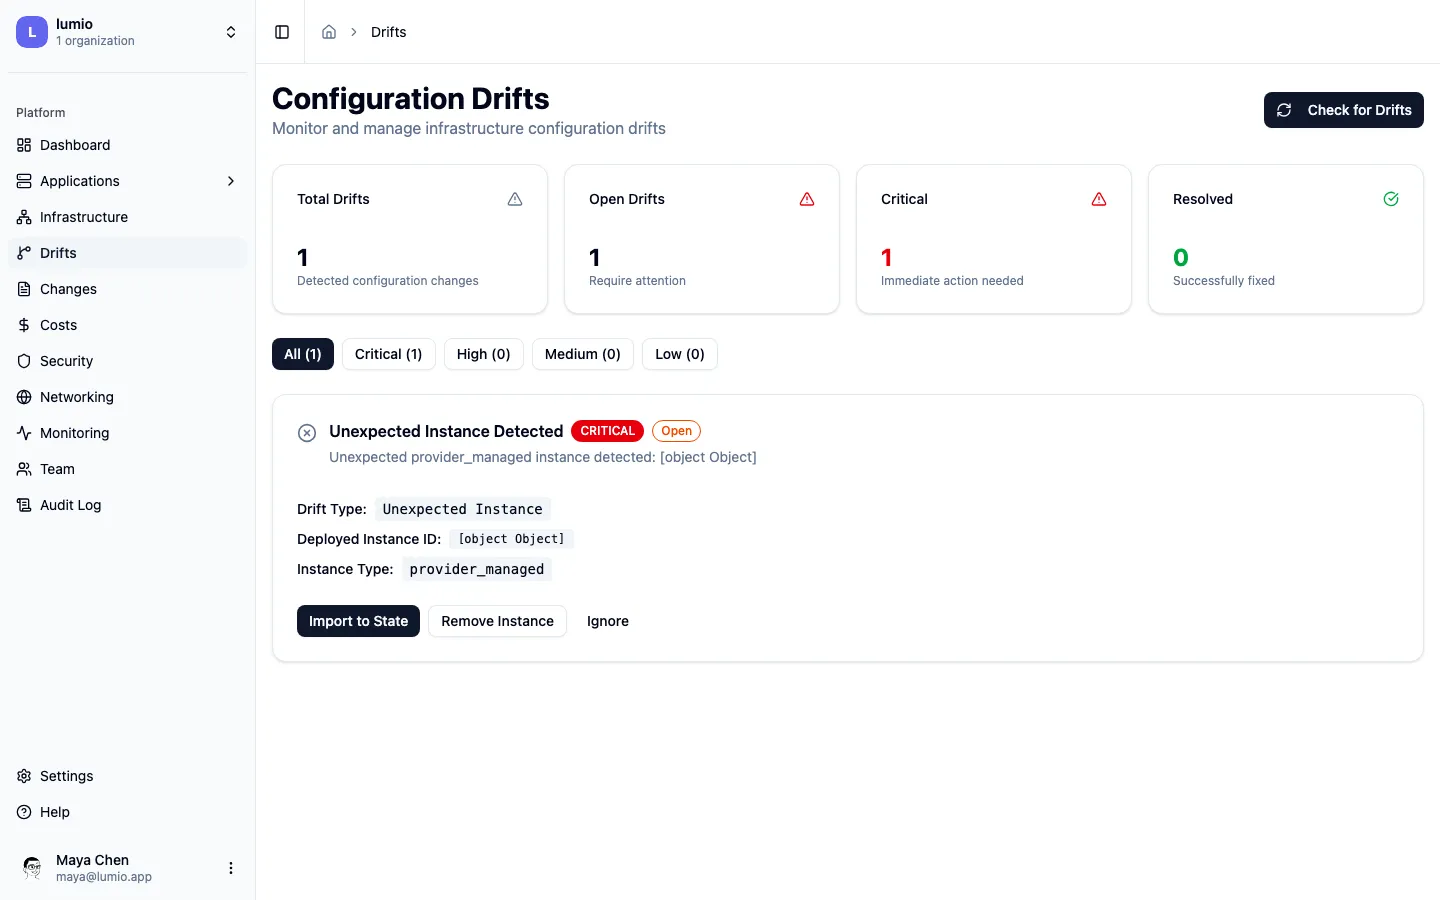
Drift Detection & Remediation
Section titled “Drift Detection & Remediation”Compare desired state against live provider state automatically. Identify unexpected resources and missing resources. Severity classification (critical, high, medium, low) with one-click remediation — import, remove, or ignore.
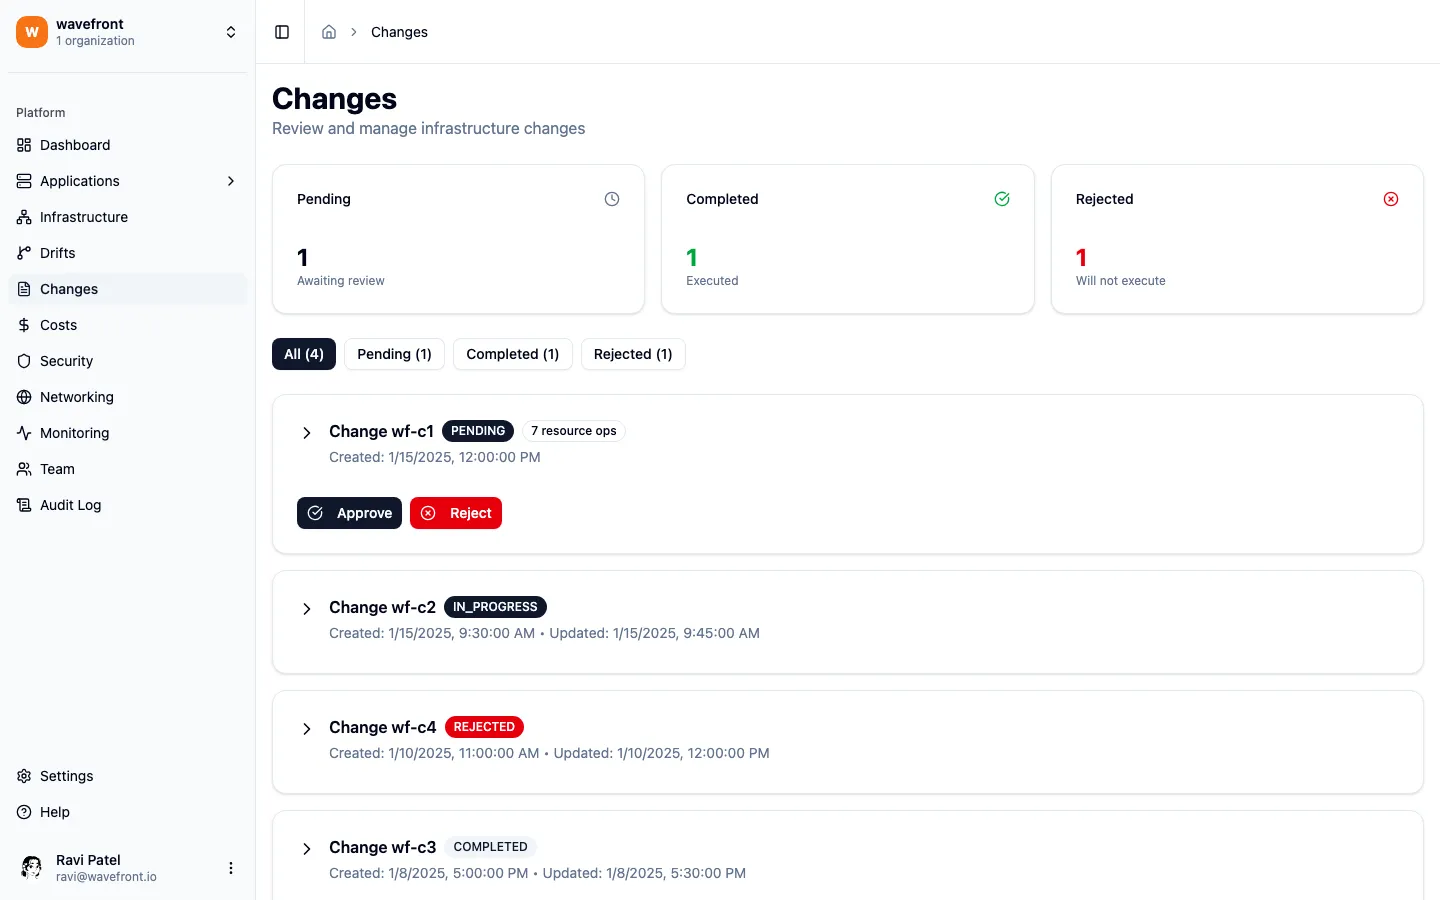
Changes & Approval Workflow
Section titled “Changes & Approval Workflow”All infrastructure changes go through a visual approval pipeline. See exactly what will change, field by field, with cost impact estimation before you approve.
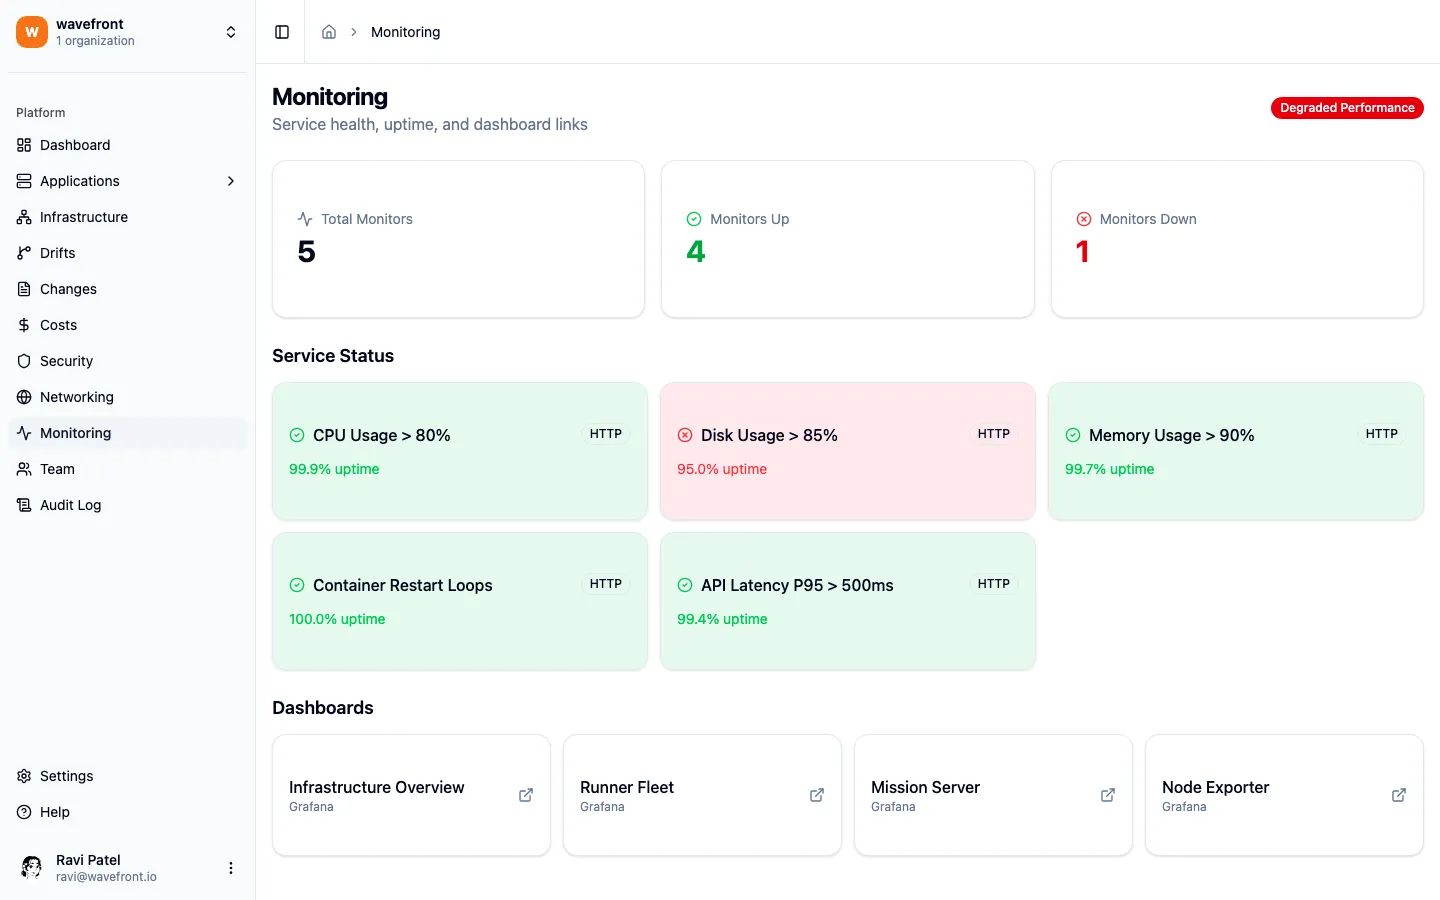
Health Monitoring
Section titled “Health Monitoring”Aggregated health from your existing monitoring stack. Uptime status from Uptime Kuma, health indicators from Grafana, service status cards — without replacing your existing tools.
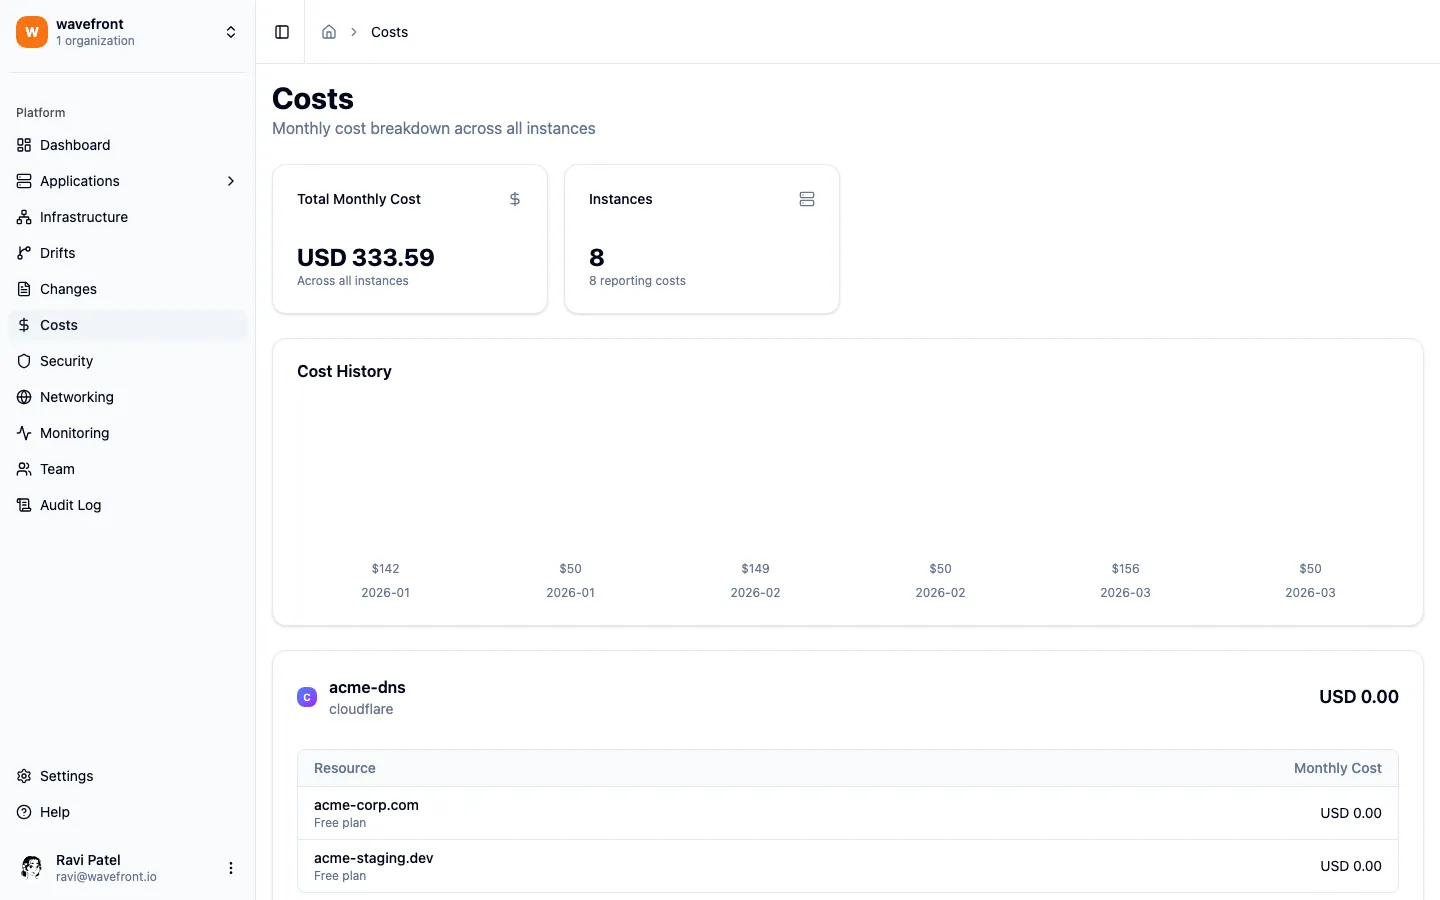
Cost Management
Section titled “Cost Management”Know what you spend before you spend it. Cost tracking by provider, monthly history with trends, and cost impact preview on every change (+$X/mo before you approve).
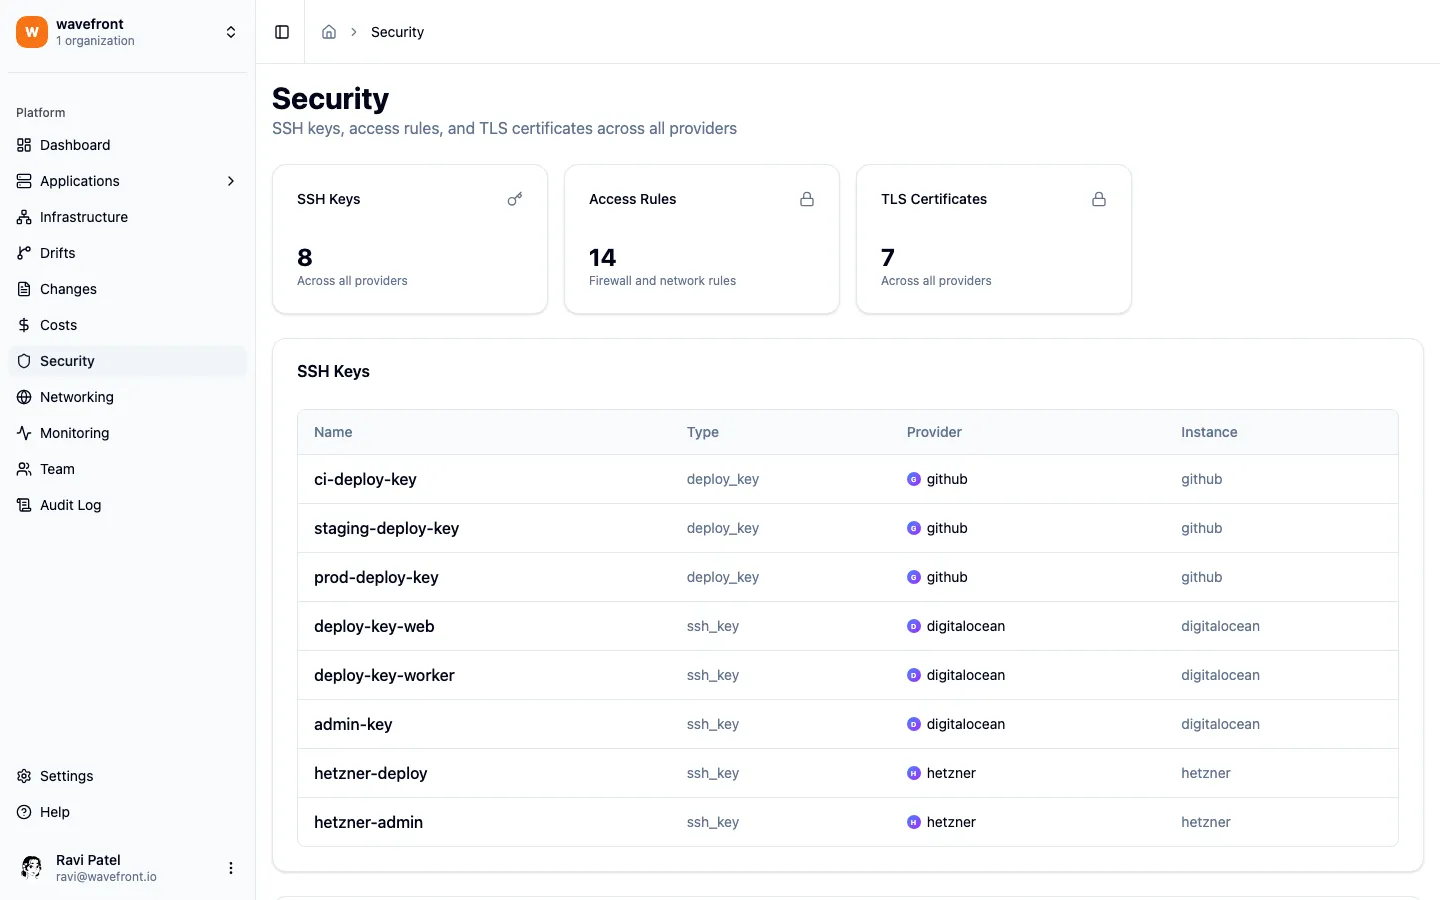
Security Overview
Section titled “Security Overview”Unified security posture across all providers. SSH key inventory, access rules and firewall entries, TLS certificate status and expiry tracking. Guardrails protect critical infrastructure (Grafana, VictoriaMetrics, Traefik) from accidental deletion.
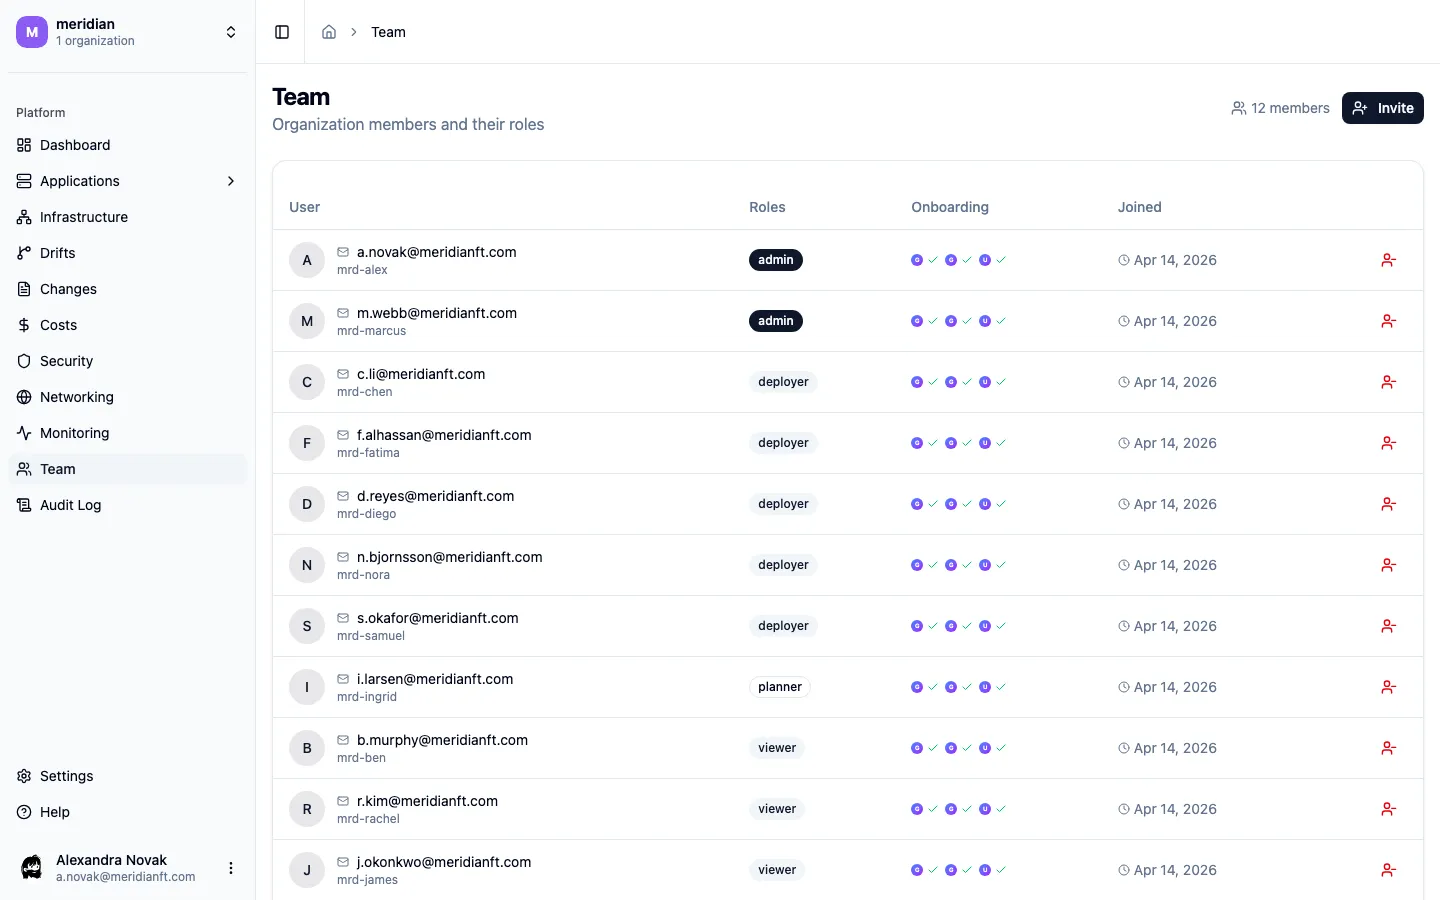
Team & Access Management
Section titled “Team & Access Management”Add or remove users across all connected tools in seconds. Centralized permissions, cross-provider onboarding and offboarding, and role-based access control.
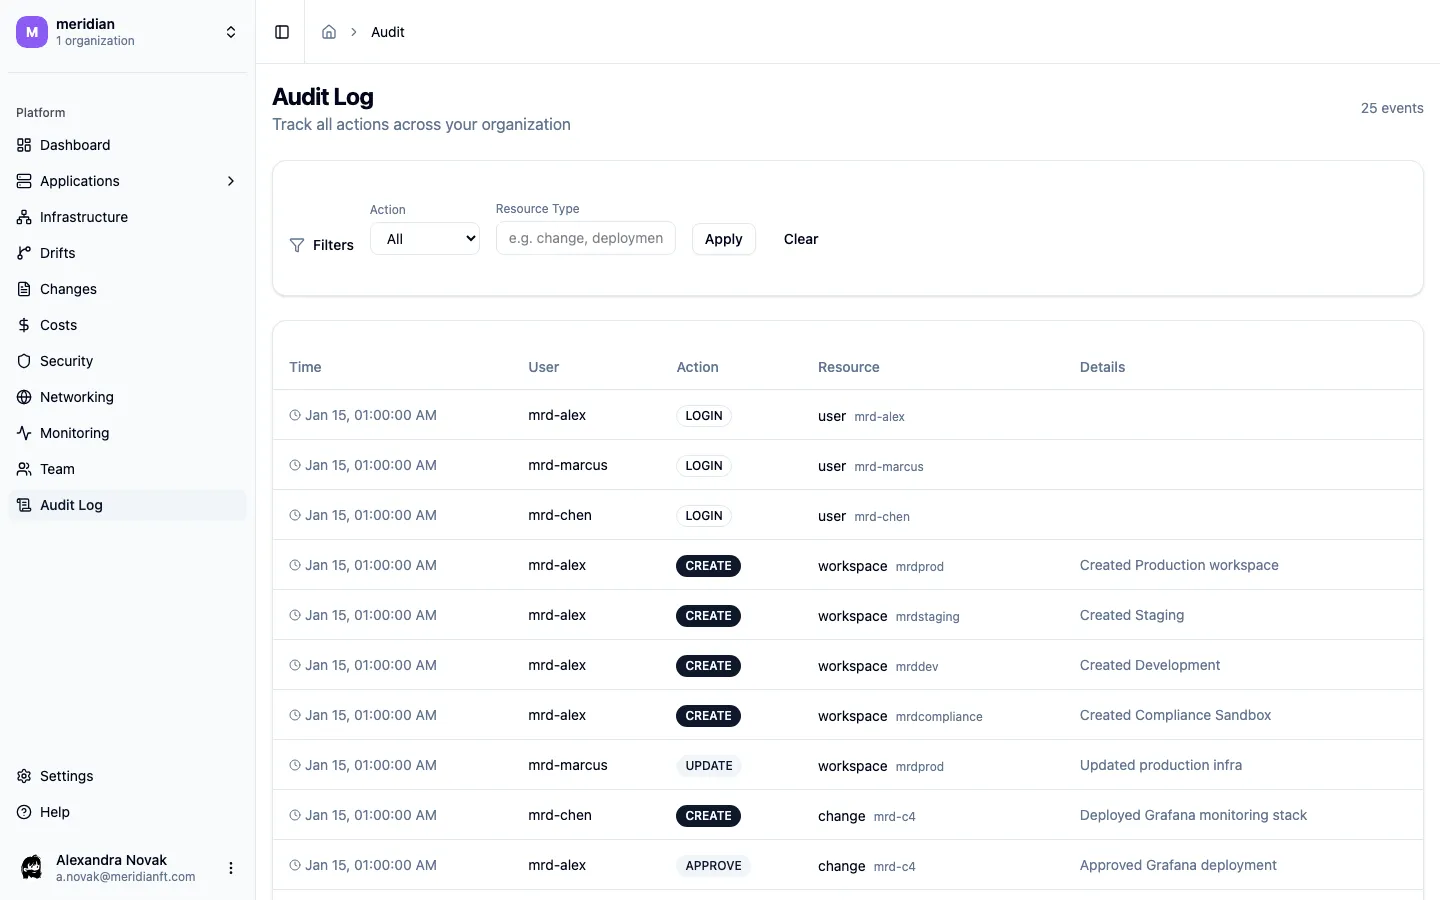
Audit Log
Section titled “Audit Log”Complete history of all infrastructure changes. Who changed what, when. Filterable by resource, user, date, and action type. Export for compliance (CSV/JSON).
Guardrail Engine
Section titled “Guardrail Engine”Operation-level guardrails prevent destructive operations on critical infrastructure. Services labeled as critical (e.g., Grafana, VictoriaMetrics, Traefik) cannot be deleted without explicitly removing the label first. Boosters can register custom rules via the GuardrailRule SPI.
Backup & Recovery (Planned)
Section titled “Backup & Recovery (Planned)”Configure backup method, schedule, and retention per resource. Multiple backup methods for 3-2-1 coverage. Supports pgBackRest, pg_dump, Restic, BorgBackup, Velero, and provider-native backups. Automated restore verification.
What’s Next
Section titled “What’s Next”We’re actively working on backup & recovery, workspace-scoped permissions, and expanded networking capabilities. An AI agent interface is on the horizon.